Control
Center
Nearly two years architecting and building a modern React and TypeScript front end from the ground up.
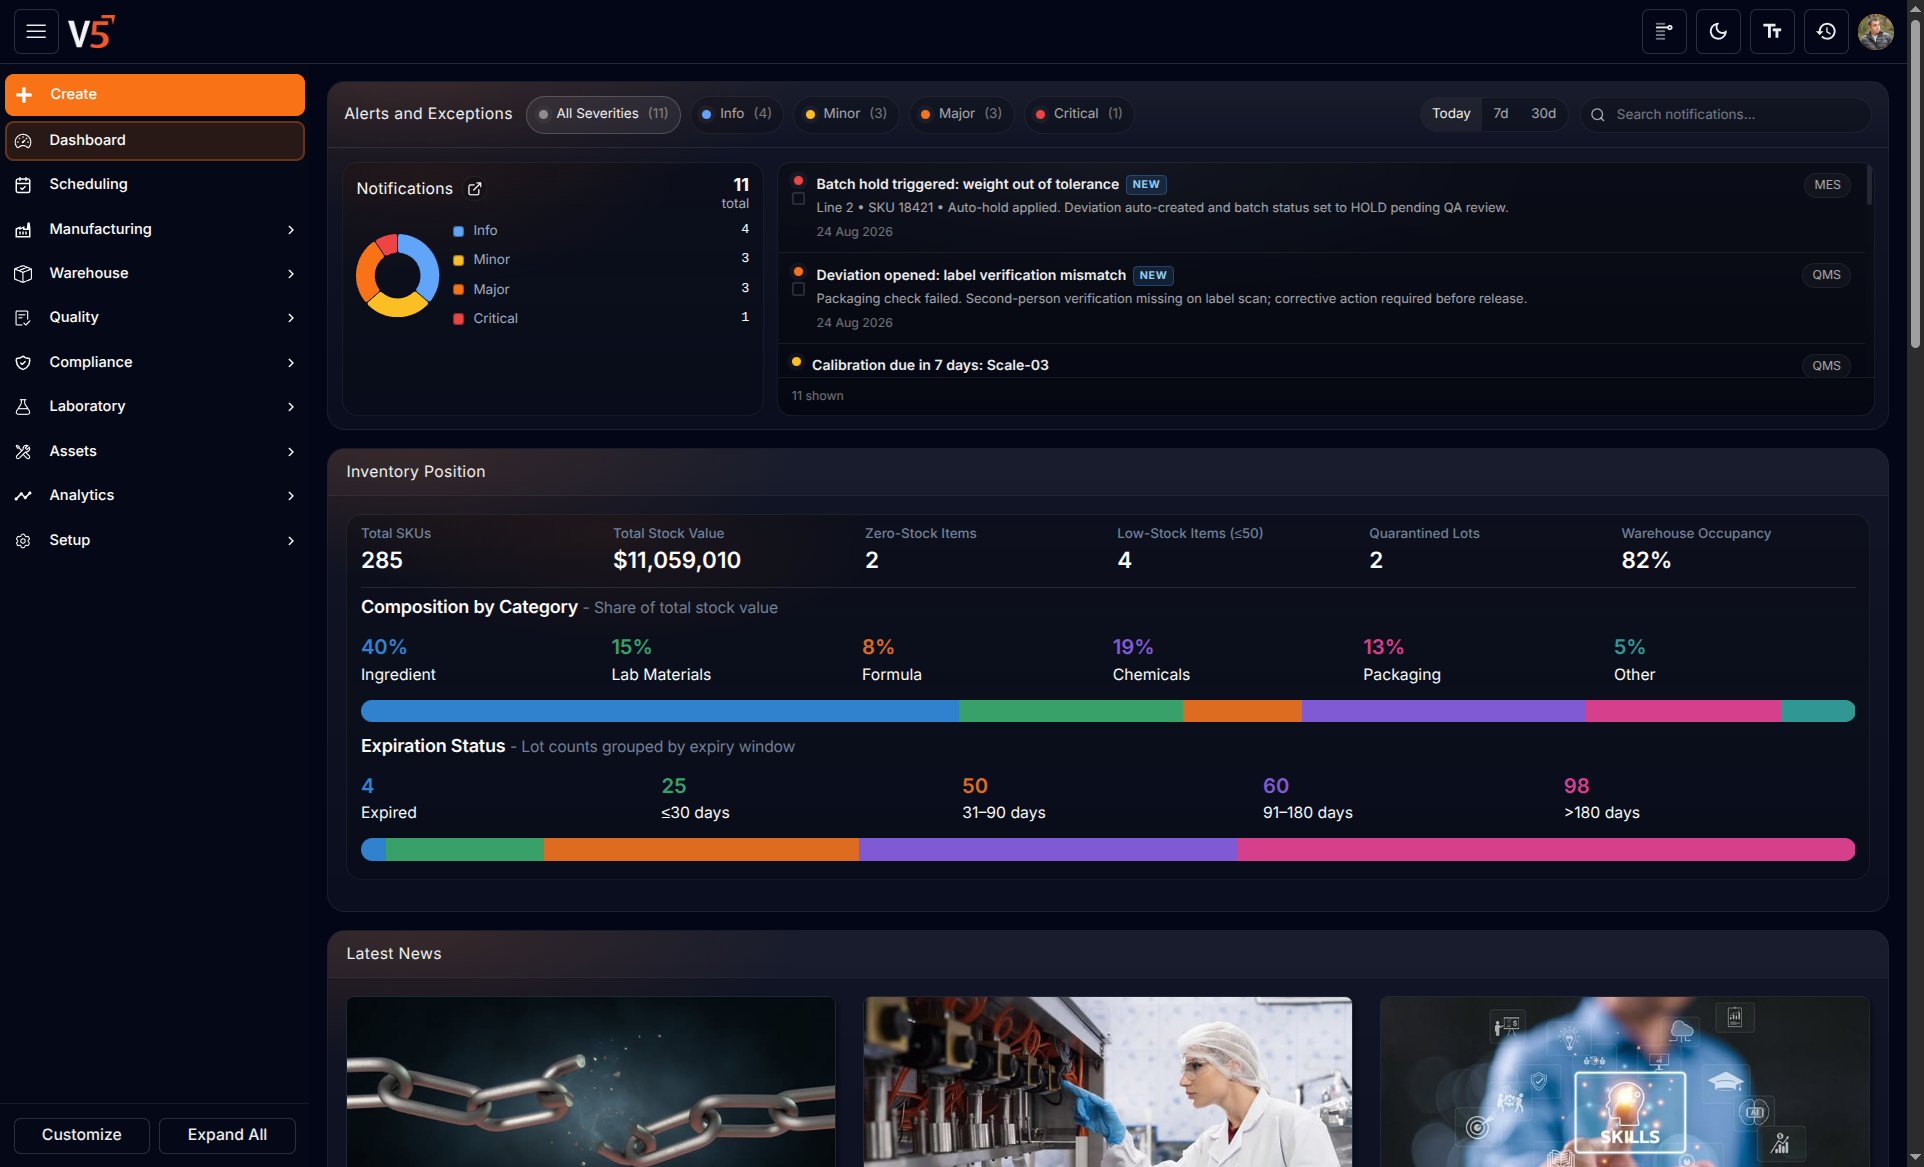
A mature product, a new front-end foundation.
Control Center is the administrative hub for SG Systems Global’s V5 traceability suite. Starting with the capabilities and domain knowledge of the established Java software, I designed the architecture and implemented its new browser-based experience from the ground up.
I owned the front-end technical direction while working with the wider team, and moved into the Java back end when a feature or integration required changes across both sides of the application.
View the original product guide ↗- Role
- Front-end architecture
Development
Technical leadership - Timeline
- Nearly two years
Primary project focus - Scope
- Front end from scratch
Java integrations
Deep workflows.
Modern expectations.
The existing product covered almost every part of V5 setup and administration: production schedules, formulas, inventory, orders, quality data, reporting, integrations and system configuration. The web front end needed to preserve that depth while making dense, interconnected workflows easier to navigate.
Translate the product, not just the screens.
I established a reusable component architecture and maintainable UI patterns for the new browser-based product, with careful attention to composition, state management and testability.
Performance was treated as a product feature. Data-heavy tables and operational screens were built to remain responsive at realistic volumes, while integration with the Java platform, Docker-based workflows and CI/CD supported dependable delivery to AWS staging.
A dashboard that adapts to each user.
Users can decide which dashboard modules matter to them, hide the rest and drag the visible items into their preferred order. That custom arrangement is saved against the user, so their workspace is restored the next time they return.

Control Center dashboardShow, hide and reorder dashboard items
One table system, many data shapes.
A single action enables inline editing across the table. Text, numeric and select fields each provide the appropriate editing control, while a drawer at the end of every row generates a more complete form for editing that record.

Dynamic table systemInline editing, generated forms and virtualised rows
From available task to scheduled work.
Users can create a calendar entry, choose from the maintenance tasks available to schedule and immediately see the new task in context. Selecting it again opens its full details and an editable form without leaving the calendar.
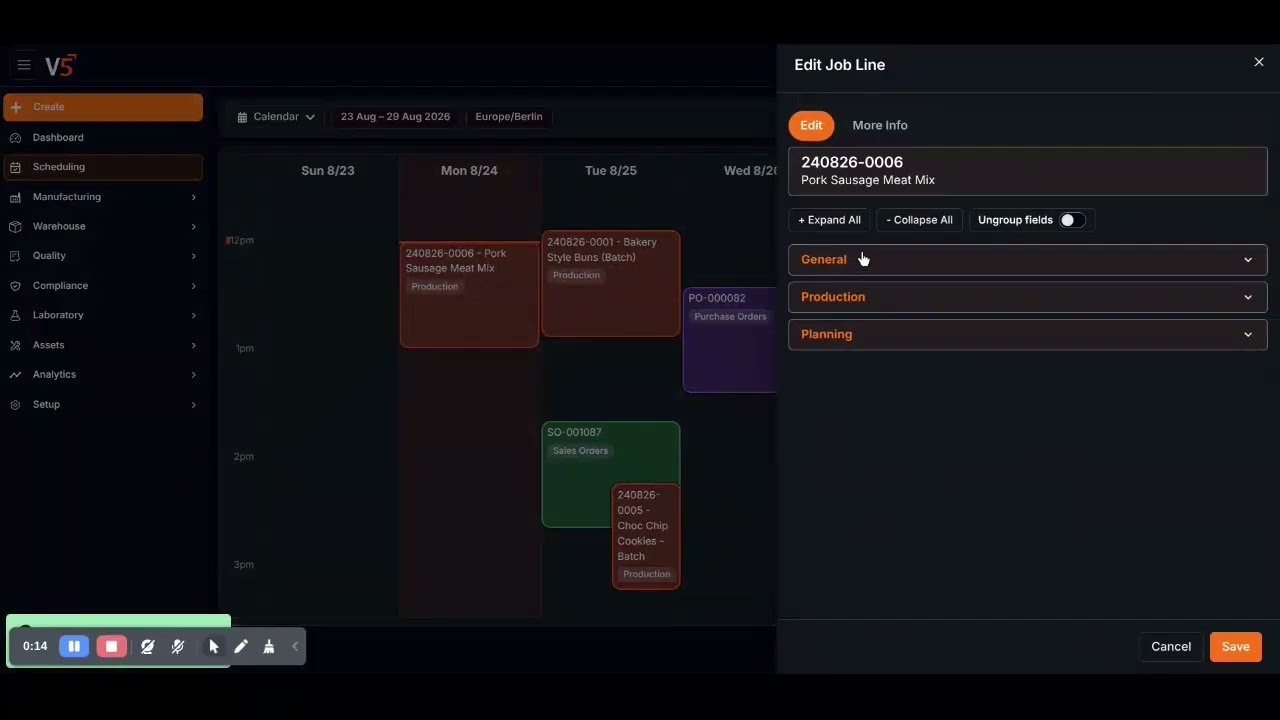
Maintenance schedulingCreate, inspect and edit tasks from the calendar
One dataset, six ways to understand it.
The same scheduling data can be explored as a calendar, list, Kanban board, heatmap, Gantt chart or swimlane view. Users can move between perspectives instantly, choosing the visual model that best supports the question they are trying to answer.

Six connected schedule viewsCalendar, list, Kanban, heatmap, Gantt and swimlanes